
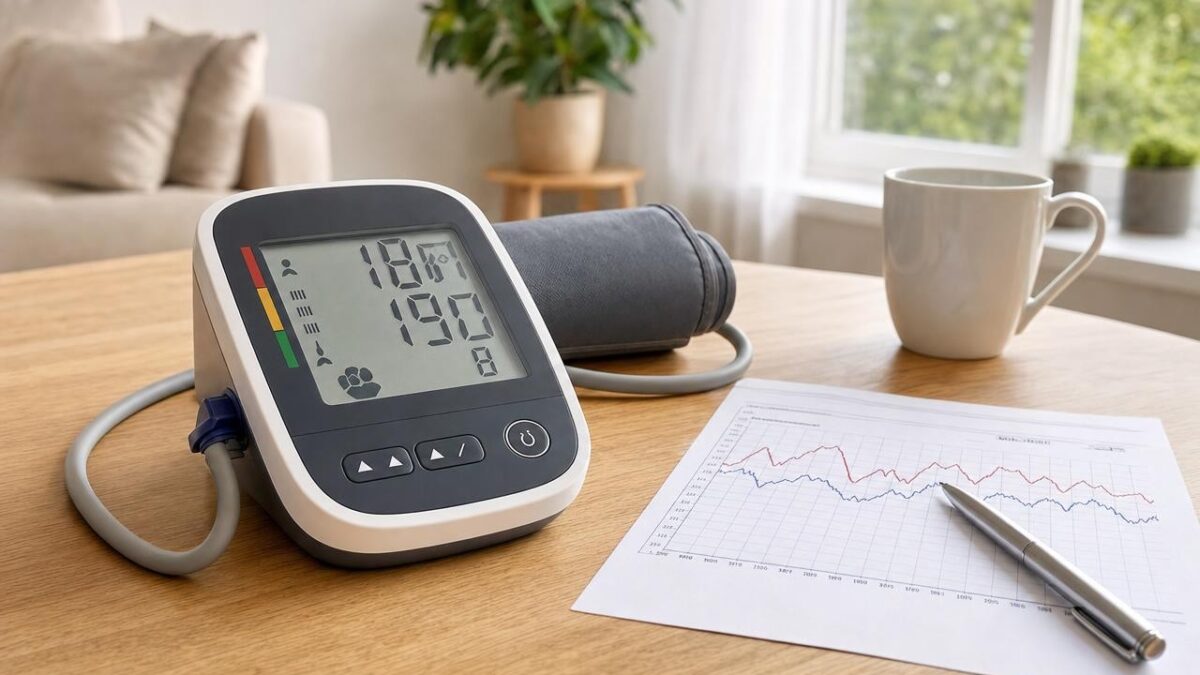
Until now, we mainly look at the figures displayed at the time of measurement. Researchers now invite us to also observe their evolution over time.
What if today’s number doesn’t tell the whole story?
A cuff around the arm, a few seconds, two numbers appearing: the tension seems normal. However, this measurement is only a snapshot at a given moment.
Dutch researchers wanted to know if the way in which blood pressure changes over the course of consultations could provide additional information.
Their analysis, presented at the 2026 congress of the European Association for the Study of Diabetes (EASD) in Milan, focuses on
57,611 participants from the UK Biobank cohortaged on average 55.4 years, 52% of whom are women.
Initially, 50,744 people had normal blood sugar levels, 5,397 had prediabetes and 1,470 had type 2 diabetes. The researchers compared their different tension measurements and calculated their variability over time.
After a median follow-up of 5.1 years1,460 participants had died, 571 had suffered a stroke and 319 had developed dementia.
The more the voltage fluctuates, the more the risk seems to increase
The finding is particularly interesting for the risk of death.
Each increase of one standard deviation in the variability of the
systolic pressure was associated with a
11% higher risk of death. For diastolic pressure, this increase was 8%.
Strokes follow a comparable trend: each additional standard deviation of diastolic pressure variability was associated with a 12% higher risk of strokeand 10% for average arterial pressure.
These associations persisted after accounting for average blood pressure, blood glucose level, and other factors.
On the other hand, no statistically significant link was found with dementia.
But it is when researchers combine blood pressure and blood sugar that the results become particularly striking.
Diabetes and highly variable blood pressure: almost three times higher risk
Compared to people with normal blood sugar and low systolic blood pressure variability, those with
type 2 diabetes and high variability
had a risk of death 2.8 times higher
during follow-up.
In people with prediabetes, high blood pressure variability was associated with excess mortality of 62% compared to the reference group.
Researchers thus estimate the risk of death at ten years to be approximately 1% in people with normal blood sugar and low variability, versus 2.9%
in those with type 2 diabetes and high variability.
Be careful, however: these two factors are studied together. It is therefore impossible to attribute this excess risk to voltage fluctuations alone.
A signal to watch out for, not yet a new diagnosis
These results are interesting, but they do not mean that fluctuating blood pressure directly causes stroke or death. The study is observational : it highlights an association, without demonstrating a cause and effect link. And the “standard deviations” used by researchers cannot be converted directly into a precise change in blood pressure in mmHg.
For Dr. Fariba Ahmadizar, who led the study, these fluctuations could nevertheless provide additional information:
“Our results suggest that changes in blood pressure over time may provide information beyond average measurements in routine care.”.
Currently, voltage variability is not used as a routine indicator. Researchers particularly want to know whether it is possible to reduce these fluctuations and whether this would really reduce the risk of stroke or death.
One thing is therefore to remember: “normal” tension remains good news, but a single number doesn’t necessarily tell the whole story. For some patients, it may also be the trajectory of tension, over months and years, that is worth looking at.